A managing partner opens next year’s budget and finds a line for the website. Someone asks what it returned. The answer on screen is a traffic chart, and a traffic chart is not website ROI. It counts visits. Visits don’t sign contracts.
For a B2B firm, website ROI is a chain. Visits turn into leads, some of those become qualified leads, a few close, and the margin on those deals gets set against what the site cost. Each link has its own number and its own home. Below is the formula, the six numbers that feed it, where each one lives, and the six-step setup that stops the chain breaking between your contact form and your customer relationship management (CRM) system.
I’m Joshua Jackai. At Jackai Agency in Vancouver I design and build websites for B2B and professional-service firms, and I set up the lead tracking behind them. The tracking is the part clients ask about last and need first.
In this guide
What does website ROI measure for a B2B firm?
Return on investment is profit gained, minus cost, divided by cost. For a website, the gain is the gross profit from deals where the site played a recorded part. Not visits. Not rankings. Not even form fills, though they feel close. Those are steps on the way, and none of them is money.
A widely cited framework in marketing research traces spending through a chain: the marketing action, its effect on customers, and then the financial result for the firm (Rust et al., 2004). A website fits that chain well: the page is the action, qualified leads are the change in the customer, and the closed deal is the financial result.
Two kinds of credit get mixed up here. A sourced deal is one where the first recorded touch was the website. An influenced deal touched the site somewhere along the way, such as a pricing page visit the week before the contract. Report both, side by side, and never add them together.
On the Snappy Kraken project, a B2B FinTech SaaS for financial advisors, the work influenced 7 figures of annual recurring revenue. I write it as influenced, not attributed, because sales, pricing and product all moved in the same period. That sentence is the honest shape of most website ROI claims.
What is the website ROI formula?
Here is the formula I use with clients. It is plain arithmetic, and the hard part is never the math but getting honest inputs.
Website ROI = (gross profit from website-sourced closed deals, minus total website cost) divided by total website cost, times 100.
Three choices inside that formula change the answer more than any tracking tool does. Use gross profit, not revenue, because a $20,000 contract that costs $12,000 to deliver returned $8,000. Count the full website cost, including staff hours. And spread the build cost over the years the site will run, often three, instead of loading it all into year one.
Here is a website ROI example with round, made-up numbers so you can see the shape. None of these figures come from a client. The build and care rates are my own published prices: US$6,450 (CA$8,950) for a custom B2B WordPress site of up to 5 pages, and US$200 (CA$279) an hour for care.
| Input | Example value | How it was worked out |
|---|---|---|
| Build cost for this year | $2,150 | The $6,450 build spread over 3 years |
| Care and updates | $7,200 | 3 hours a month at $200 an hour |
| Staff time on content | $4,500 | 60 hours at an internal cost of $75 an hour |
| Total website cost | $13,850 | The three lines above added together |
| Website-sourced closed deals | 4 | Deals in the CRM whose recorded lead source was the website |
| Gross profit per deal | $8,000 | A $20,000 first-year contract at a 40% margin |
| Gross profit from the website | $32,000 | 4 deals at $8,000 each |
The website ROI here is $32,000 minus $13,850, divided by $13,850, which comes to 131%. Each dollar the site cost came back as about $2.31 of gross profit.
Now run it on revenue instead. Four deals at $20,000 is $80,000, and the same website ROI formula says 478%. Nothing about the website changed. The number simply stopped counting what it costs to deliver the work, and in my experience that is the first figure a finance lead pushes back on.
One more adjustment for firms with repeat clients. A client who renews for three years is worth more than the first invoice. Researchers define a customer’s value as the expected sum of discounted future earnings from that customer (Gupta, Lehmann and Stuart, 2004). If your clients stay, run the formula twice, once on first-year margin and once on lifetime margin, and show both.
| Your situation | Which version to report |
|---|---|
| Clients buy once | First-year gross profit |
| Clients renew or stay on retainer | First-year and lifetime gross profit, side by side |
| The site launched alongside other big changes | Influenced deals, worded as “contributed to” |
| Only a handful of deals close each year | A rounded range, tracked quarter by quarter |
Which six numbers feed the formula, and where does each one live?
When a website ROI report falls apart in a meeting, it is usually because one of these six numbers was guessed, or pulled from the wrong place.
| Number | Where it lives | What usually goes wrong |
|---|---|---|
| 1. Sessions by landing page and channel | Google Analytics 4 (GA4) | Reported as the result instead of the first link |
| 2. Form submissions with their lead source | Hidden form fields passed into the CRM | Source field blank, typed by hand, or set to “Other” |
| 3. Qualified leads | A lifecycle stage in the CRM | No written rule for what counts |
| 4. Closed deals and contract value | Deal records in the CRM | Deal not linked to the contact who filled in the form |
| 5. Gross margin | Finance, by service line | Revenue used instead |
| 6. Total website cost | Invoices plus time sheets | Staff hours left out |
Three of the six live in the CRM. GA4 can tell you a form was submitted, but it can’t tell you the lead was a good fit, that the deal closed, or what the client paid. The CRM can, but only if the lead arrived carrying its lead source.
Where does the lead source get lost between the form and the CRM?
On the B2B sites I audit, the lead source breaks in one of four places. None of them is exotic, and each one quietly empties your website ROI formula of its inputs.
- Links go out untagged. A newsletter, a partner’s site and a QR code on a trade-show banner all send visitors with no UTM parameters, the short tags on the end of a link that name its source, medium and campaign. The source never enters the system.
- The form drops the tags. The visitor arrived tagged, but the form has no hidden fields to carry those values into the CRM. The lead lands with no source.
- Nobody records the conversion page. The lead record says “website” and nothing else, so the case study or pricing page that did the work gets no credit.
- AI referrals land in direct. Someone asks ChatGPT for a firm like yours and clicks the link. Unless that traffic is split out, it sits in the direct bucket next to people typing your address.
The usual lead source patch is a “How did you hear about us?” field. In my experience it helps as a second opinion and fails as the main record. People answer from memory, many pick the first option in the dropdown, and “Google” covers everything from a paid ad to a search for your firm’s name.
There is a second problem even when tagging works. Most reports give all the credit to the last click before the form. A study of multichannel buying journeys found that once earlier visits are allowed to carry forward into later ones, each channel’s share of conversions looks significantly different from what the usual metrics show (Li and Kannan, 2014). Another model showed last-touch credit over-rewards ad exposure and often lowers advertiser profit compared with a method that shares credit (Berman, 2018).
How do you wire lead source tracking so every lead arrives tagged?
This is the setup I install on an existing site, and it needs no redesign. The full method, with the weekly report format, is on my lead attribution case study.
- Write a tagging convention. One document that says how every link you control gets its utm_source, utm_medium and utm_campaign values: paid, email, social, partner links and QR codes. Written down, so the next person tags the same way without asking.
- Capture the first touch in the session. A small script stores the original source, the referring site, the landing page and any ad click ID when the visitor arrives. The value survives a visitor who reads three pages before filling in a form.
- Pass it through hidden fields. Every form carries the stored lead source values into matching CRM contact properties at the moment of submission. Nobody types anything.
- Record the conversion page. The lead record shows which page the form was on, and the report shows first touch and last touch side by side instead of picking one.
- Split AI referrals out of direct. Traffic from AI assistants that pass a referrer gets its own channel. Visits that don’t pass one are inferred from landing page and session pattern, and reported as probable rather than certain.
- Send one page a week. Grouped by channel: leads, qualified leads, closed deals and cost per closed deal. One page is short enough that someone reads it.
Steps 2 and 3 are where most setups fail, because they sit between two tools. GA4 belongs to marketing, the CRM belongs to sales, and the hidden fields belong to whoever built the form. When a firm calls me about tracking, it is usually because nobody owned that gap.
Which leads count: every form fill or only qualified leads?
Only qualified leads belong in the website ROI chain. A raw form count includes spam, job seekers, students, vendors pitching their own services and existing clients asking for support. None of those turns into a deal, and all of them flatter your cost per lead.
The fix is a written rule. Sales and marketing agree, in one or two sentences, what makes a lead qualified: firm size, role, the service asked about, a budget signal, location. That rule then sets the lifecycle stage in the CRM, so the count comes from a field and not from someone’s opinion on a Friday.
HubSpot calls that lifecycle stage a marketing-qualified lead (MQL). Advisor Websites, a Vancouver SaaS platform for financial advisors, shows why the label matters. After the webinar replay library and opt-in templates went live, organic traffic was up 58% and MQL conversion was up 28%. The second number sits closer to money: more visitors is pleasant, but a higher share of them becoming qualified leads is what the formula can use. The Advisor Websites case study shows the pages behind both numbers.
One edge case: a marketing-qualified lead is not the same as a lead sales has accepted. If your sales team rejects much of what marketing passes over, track that rejection rate too. A site that sends 40 qualified leads a quarter, with 30 of them rejected, has a definition problem, not a traffic problem.

How do you work out cost per lead and cost per qualified lead?
Cost per lead is total website cost divided by the number of leads in the same period. It is the easiest number to calculate and the easiest to flatter, because spam and poor-fit inquiries push it down.
Using the same made-up year from the formula section, with $13,850 in total website cost:
| Measure | Count | Cost each |
|---|---|---|
| Cost per lead (all form fills) | 160 | $87 |
| Cost per qualified lead | 40 | $346 |
| Cost per closed deal | 4 | $3,463 |
The $87 cost per lead looks great on a slide and tells you very little. The $346 figure is the one to compare against other channels, because qualified leads from paid search, a referral partner or a trade show can be priced the same way. If a channel’s cost per qualified lead is three times the website’s, that is a budget conversation with real numbers in it.
Two rules keep cost per lead honest. Use the same period for cost and leads, so a January build invoice is not set against December leads. And count staff time at a real internal rate, because the hours your team spends writing and updating pages are part of what the site costs.
Cost per closed deal is the bridge back to website ROI. At $3,463 a deal against $8,000 of gross profit a deal, the example site pays for itself and then some. If those two numbers ever flip, you will see it here first.
What does a measured chain look like on a real B2B site?
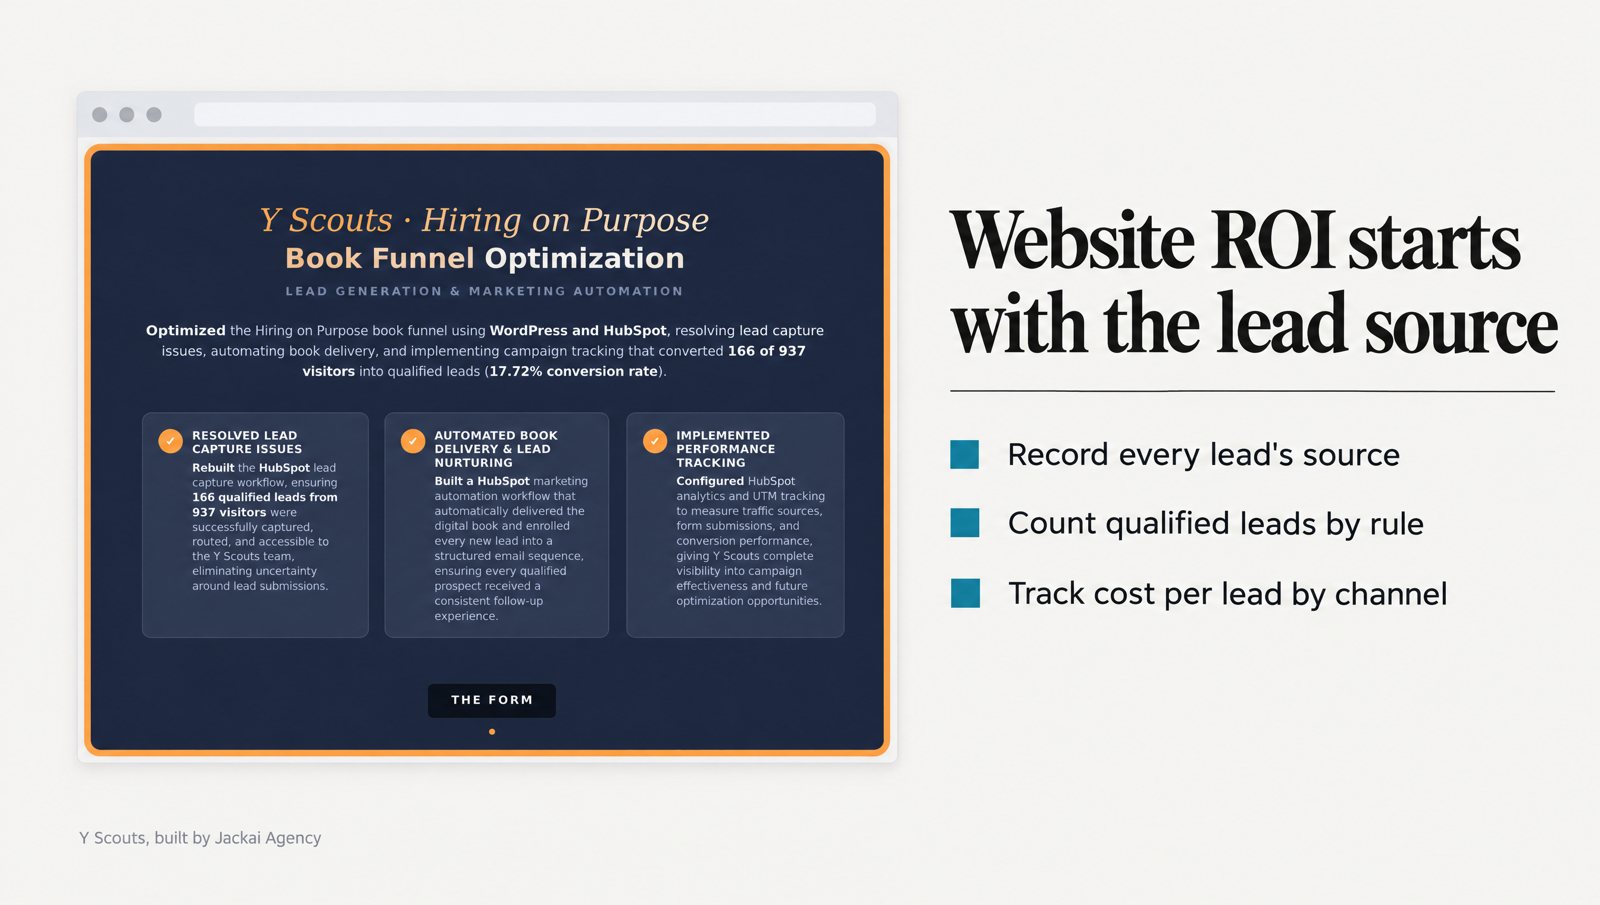
Y Scouts is an executive search firm in Scottsdale, Arizona, running WordPress and HubSpot together. Before the work, no UTM parameters reported into HubSpot, so the founder could not tell which channel produced a lead. With no lead source, no channel decision could be made on evidence.
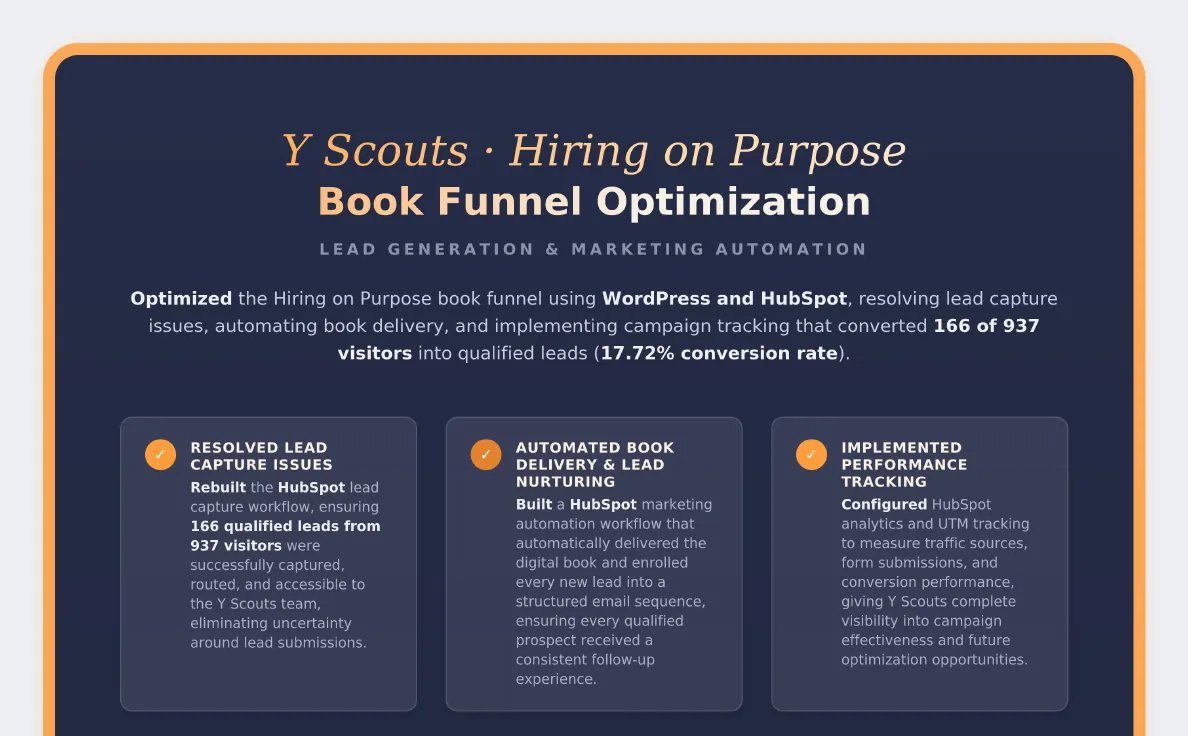
I wired the Hiring on Purpose book funnel with HubSpot capture, automated delivery and UTM tracking, connected every blog post to a HubSpot blog-to-lead-gen flow, and set up 3 lead-capture pages. The video cadence moved from one hour-long episode a week to one episode plus three short videos, cut from interviews already on file.
Here is the chain, link by link:
- Attention: across Q3 2025, with nothing new filmed, monthly YouTube views went from 162 to 4,565.
- Leads: the Hiring on Purpose funnel converts visitors to leads at 17.7%, 166 of 938, read from the client’s own HubSpot.
- Qualified leads: inbound MQLs went from 17 to 30 in the same quarter.
- Sales conversations: scheduled demos went from 22 to 37 in the same quarter.
Two caveats sit beside those numbers. First, the work contributed to that movement. I never write that it caused it. Second, when publishing paused in Q4, views fell back to 483 a month. That fall-off is the clearest measure of what the cadence was worth, and proof that it is a rhythm someone has to hold.
Notice where the public chain stops: at demos. Placements and fees are the client’s numbers, not mine to publish. Inside the firm, that last link depends on the same thing as the rest of the chain, each submission becoming a HubSpot contact with a lead source attached. The Y Scouts case study has the full before-and-after table.
What should you leave out of website ROI?
Some numbers feel like returns and are not. Leaving them out makes the report easier to defend.
- Traffic and rankings. Useful for diagnosing the top of the chain. Not a return.
- Searches for your own name. Someone who types your firm’s name was probably coming anyway. In large field experiments at eBay, ads on searches for the brand’s own name showed no measurable short-term benefit, and paid search returns overall were a fraction of the non-experimental estimates (Blake, Nosko and Tadelis, 2015). Report those leads, but don’t credit the website with creating the demand.
- Before-and-after comparisons where other things moved. If you launched a site, hired a salesperson and raised prices in the same quarter, the site can’t claim the whole change. In big advertising experiments on Facebook, common observational methods often failed to recover the effect the randomized tests measured (Gordon et al., 2019). Say “contributed to” and name what else changed.
- False precision. In 25 large field experiments with major US retailers and brokerages, most reaching millions of customers, the median confidence interval on advertising ROI was over 100 percentage points wide (Lewis and Rao, 2015). A firm closing a few dozen deals a year has far less data than that. Report a rounded figure and watch the trend across quarters.
Leave out one more thing: a verdict in the first month after launch. If your sales cycle runs three months, a lead that arrives in March may not sign until June. Judge a new site on qualified leads early, and on website ROI once a full sales cycle has passed.
How do you start measuring website ROI in two weeks?
You start with a baseline, not a redesign. On a first call I record your current lead count, mobile conversion rate and AI-referred traffic, so every later number has something to be compared against.
Then the tracking goes in. Lead Source Reporting is that engagement. It adds lead capture forms to the pages that already get traffic and wires lead source tracking from GA4 and UTM parameters through to HubSpot or your existing CRM. First and last touch sit side by side, AI referrals are split out of direct, and a one-page weekly report arrives by channel. It takes two weeks from kickoff, runs on the site you have, and costs US$1,875 (CA$2,600).
After one full sales cycle you have the six numbers, your cost per lead and cost per qualified lead by channel, and a website ROI figure your finance lead can check line by line. Book a 30-minute call and I’ll measure your starting numbers on it.
Sources
Peer-reviewed research
- Berman, R. (2018). Beyond the last touch: Attribution in online advertising. Marketing Science, 37(5), 771-792.
- Blake, T., Nosko, C., and Tadelis, S. (2015). Consumer heterogeneity and paid search effectiveness: A large-scale field experiment. Econometrica, 83(1), 155-174.
- Gordon, B. R., Zettelmeyer, F., Bhargava, N., and Chapsky, D. (2019). A comparison of approaches to advertising measurement: Evidence from big field experiments at Facebook. Marketing Science, 38(2), 193-225.
- Gupta, S., Lehmann, D. R., and Stuart, J. A. (2004). Valuing customers. Journal of Marketing Research, 41(1), 7-18.
- Lewis, R. A., and Rao, J. M. (2015). The unfavorable economics of measuring the returns to advertising. The Quarterly Journal of Economics, 130(4), 1941-1973.
- Li, H., and Kannan, P. K. (2014). Attributing conversions in a multichannel online marketing environment: An empirical model and a field experiment. Journal of Marketing Research, 51(1), 40-56.
- Rust, R. T., Ambler, T., Carpenter, G. S., Kumar, V., and Srivastava, R. K. (2004). Measuring marketing productivity: Current knowledge and future directions. Journal of Marketing, 68(4), 76-89.