8 Stages of an AEO Experimentation Roadmap
Eight stages for testing AI visibility the way you would test a landing page: a written hypothesis, a frozen prompt set, repeated baselines, a control group, an honest sample size, a set wait and a written decision. Written by a Vancouver web designer who sells this work, with his own 0 of 9 baseline shown.
 Joshua Jackai
20 min read
Published 15 November 2026 · Last updated and fact-checked November 2026
Short answer: An AEO experimentation roadmap has 8 stages: one hypothesis, a fixed prompt set, a repeated baseline, clear metrics, a control, an honest sample size, a set wait and a written decision. Run each prompt more than once, because ChatGPT gave different code for the same prompt in 75.76% of tasks in one benchmark (Ouyang and colleagues, 2024).
A marketing lead at a Burnaby software firm rewrites the services page, adds an FAQ, and asks ChatGPT the next morning whether her company is the best choice. It names her firm. She tells the CEO it worked. A week later she asks again and it names three competitors instead. Nothing changed on her site. What changed was the dice.
I’m Joshua Jackai. I run Jackai Agency, a web design practice in Vancouver, and I sell AI visibility work. That’s a reason to read this with care, so here’s my rule: I don’t call any change a win until it beats a baseline that was measured the same way. This guide is the testing half of the job. For the build half, the page changes themselves, read my 9 AI Visibility Optimization Steps: 2026 Field Guide.
In this guide
Key takeaways
- Answers move on their own. Even with temperature set to 0, ChatGPT was not fully repeatable in a study of 829 coding problems (Ouyang, Zhang, Harman and Wang, 2024).
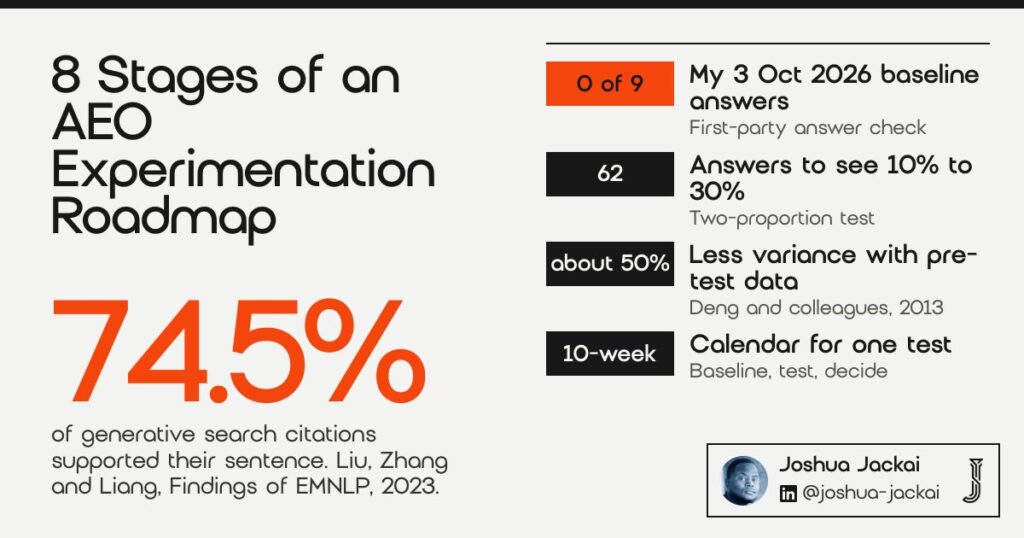
- Being cited isn’t the same as being cited correctly: only 74.5% of citations in four generative search engines supported their sentence (Liu, Zhang and Liang, 2023).
- Content changes can move visibility in generative engine answers by up to 40% in a lab benchmark (Aggarwal and colleagues, KDD 2024), and the effect varied by domain.
- Using pre-test data cut variance by about 50% at Bing, so the same test needed half the users or half the time (Deng, Xu, Kohavi and Walker, 2013).
- My own 3 October 2026 check ran 3 Vancouver prompts 3 times each through OpenAI’s API with web search. Jackai Agency was named in 0 of 9 answers. That’s a baseline, not a test.
| # | Stage | What you produce | Evidence behind it |
|---|---|---|---|
| 1 | Hypothesis | One change, one prompt group, one expected result | Kohavi and colleagues, 2009 |
| 2 | Fixed prompt set | 20 to 60 buyer prompts, frozen for the test | Aggarwal and colleagues, 2024 |
| 3 | Repeated baseline | 3 or more runs per prompt per engine | Ouyang and colleagues, 2024 |
| 4 | Metrics | Mention rate, citation rate, citation accuracy, AI referral sessions, conversions | Liu, Zhang and Liang, 2023 |
| 5 | Control | Untouched pages or prompts measured on the same days | Kohavi and colleagues, 2009 |
| 6 | Sample size | Answers needed to detect the change you care about | Kohavi and colleagues, 2009 |
| 7 | Wait and cadence | Same weekday, same engines, 4 to 8 weeks | Deng and colleagues, 2013 |
| 8 | Decision | Ship, extend or drop, written in a test log | My own practice |
1. What question is the test answering?
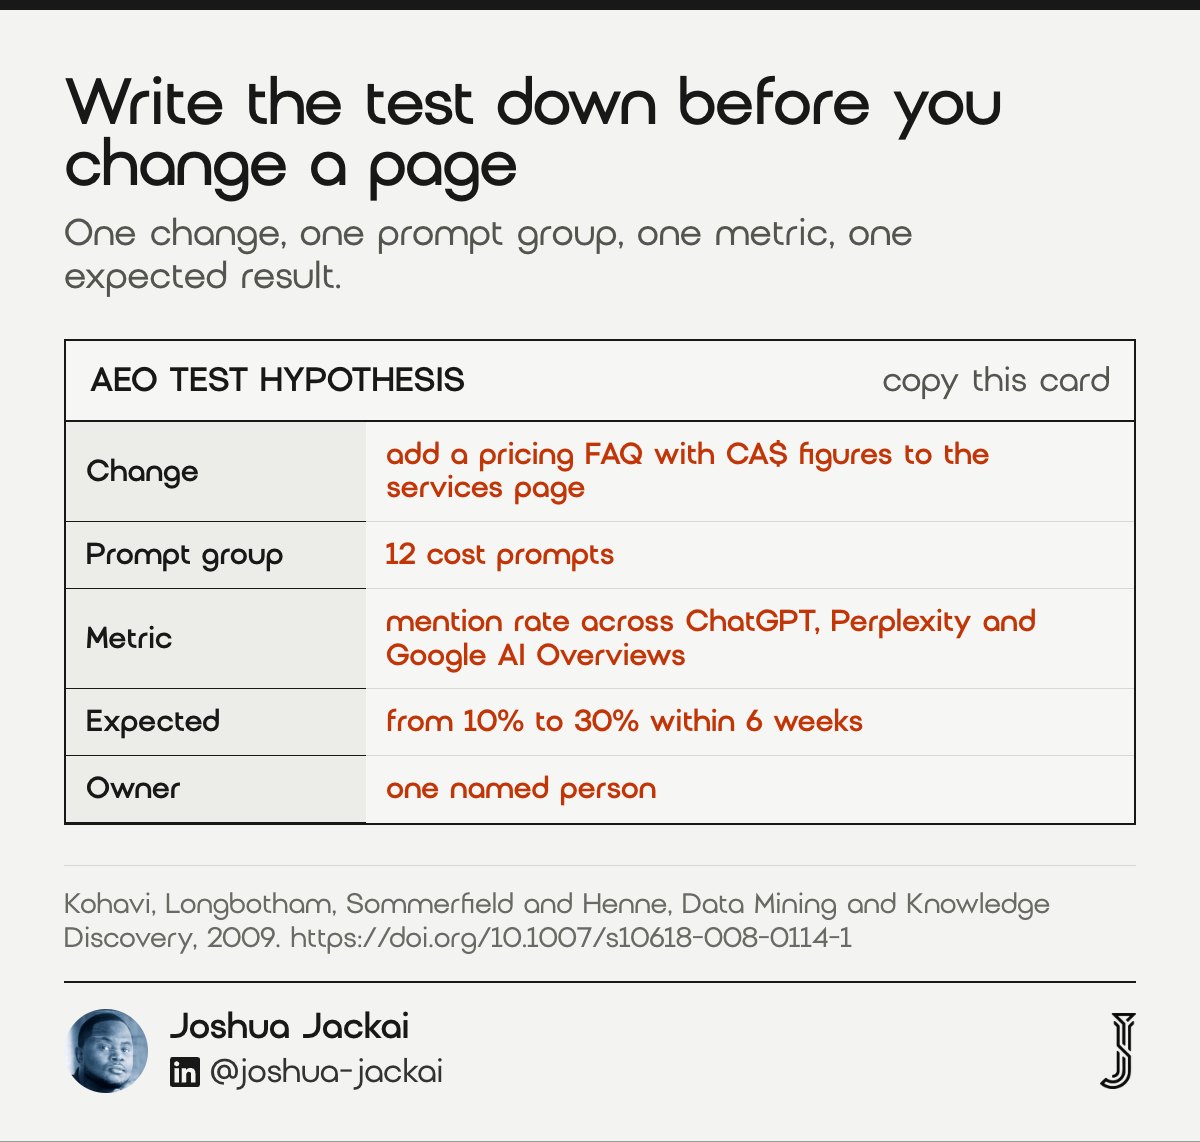
An AEO test starts with a written hypothesis: one change, the prompts it should affect, and the result you expect. It suits any team that has already made page changes and can’t say which one helped. Controlled tests are the standard way to show cause, per a 2009 survey in Data Mining and Knowledge Discovery (Kohavi and colleagues).
- Write down: the change, the prompt group, the metric and the expected size of the lift
- Limit: one change per test, or one bundle you treat as a single change
- Owner: one named person who runs the checks
- Time to set up: about 30 minutes
- Watch for: “we updated the whole site” as the hypothesis
Most AI visibility work I’m asked to review has no hypothesis at all. A team rewrites five pages, adds schema, posts on LinkedIn and gets a mention in a podcast, all in the same month. Then they ask whether “AEO worked”. There’s no way to answer that, because four things changed and nobody wrote down what they expected.
A hypothesis fixes that before any work starts. It reads like this: “If I add a pricing FAQ with Canadian dollar figures to the services page, the mention rate on our 12 cost prompts will rise from 10% to 30% within six weeks.” That sentence names the change, the prompts, the metric, the size of the lift and the deadline. If any part is missing, the test can’t fail, and a test that can’t fail can’t teach you anything.
Kohavi and his co-authors wrote the practical guide to online controlled experiments that web teams still cite. Their case for testing over opinion is the one I use with clients.
“Controlled experiments embody the best scientific design for establishing a causal relationship between changes and their influence on user-observable behavior.”
Ron Kohavi, Roger Longbotham, Dan Sommerfield and Randal Henne (Data Mining and Knowledge Discovery, 2009)
2. Which prompts go in the fixed prompt set?
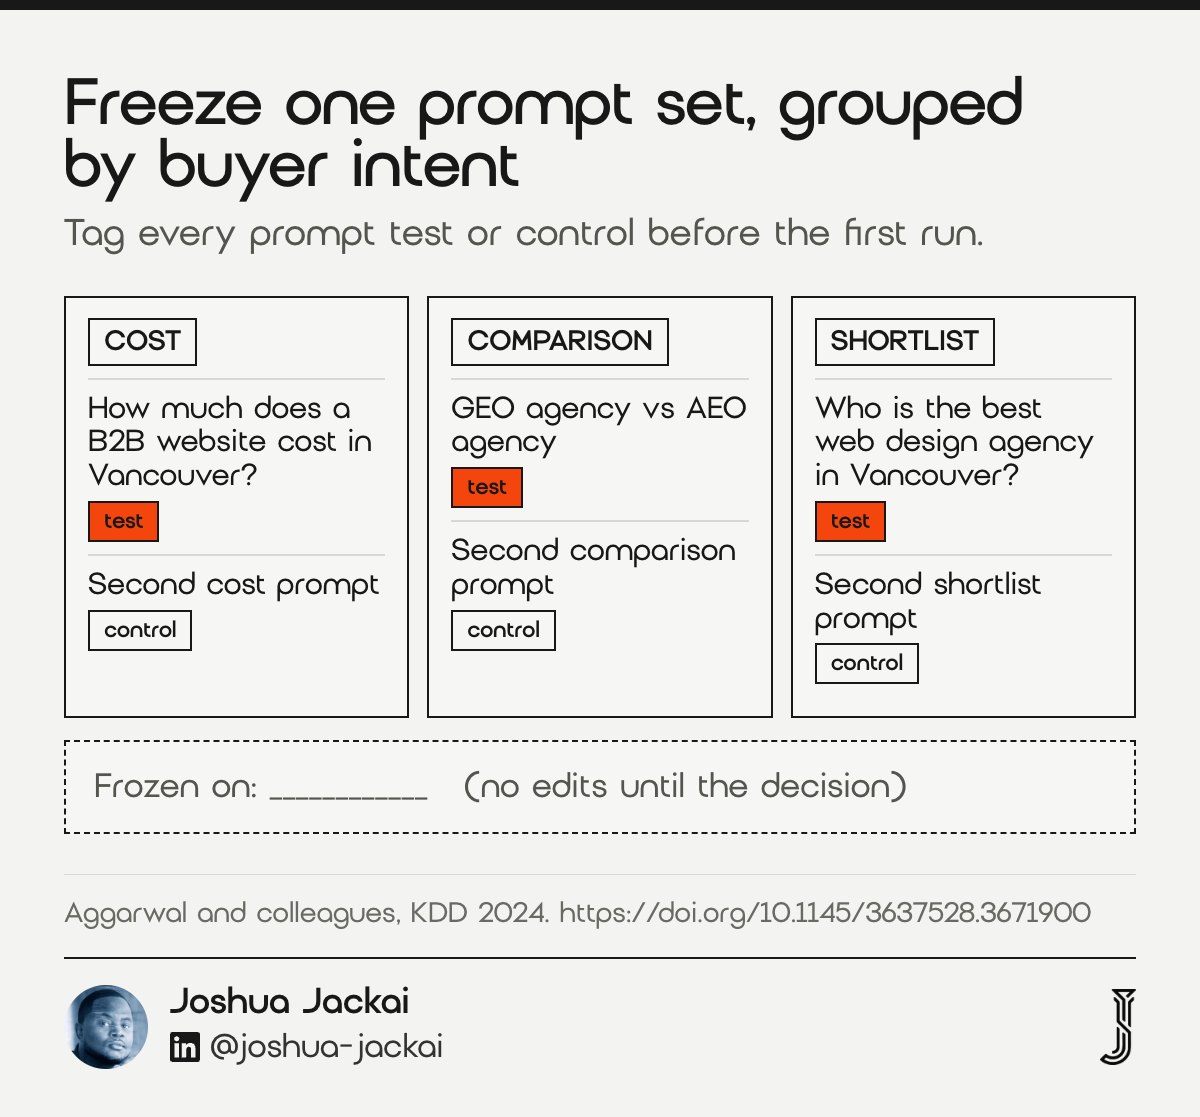
A fixed prompt set is the list of questions you ask the engines on every check, word for word, for the length of the test. It suits teams that want a weekly number. In the GEO-bench study, the effect of content changes varied across domains (Aggarwal and colleagues, KDD 2024), so build prompts from your own buyers’ questions.
- Size: 20 to 60 prompts for a small B2B firm, split into test and control groups
- Sources: sales call notes, Search Console queries, People Also Ask questions
- Engines: ChatGPT, Perplexity and Google AI Overviews at minimum
- Location: set to Vancouver or your service area where the tool allows it
- Rule: frozen for the whole test; new prompts start a new test
The prompts are the population you’re sampling, so choose them the way a buyer would type them. “Who is the best web design agency in Vancouver?” is a real prompt. “Leading provider of innovative digital solutions” isn’t. I pull prompts from three places: the questions people ask on discovery calls, the queries already showing in Google Search Console, and the People Also Ask boxes for the service. For this post, the Vancouver People Also Ask data included “How do you measure AI visibility?” and “Can AI searches be tracked?”, so both are answered in the FAQ.
Group the prompts by intent: cost, comparison and shortlist prompts behave differently. Aggarwal and colleagues found that the same content change helped more in some domains than others, which is a warning against averaging every prompt into one score.
“content creators have little to no control over when and how their content is displayed.”
Pranjal Aggarwal and colleagues wrote of generative engines (KDD 2024)
Once the set is written, freeze it. Adding prompts halfway through changes the denominator, and the rate moves for reasons that have nothing to do with your site.
3. How do you take a baseline when answers change every time?
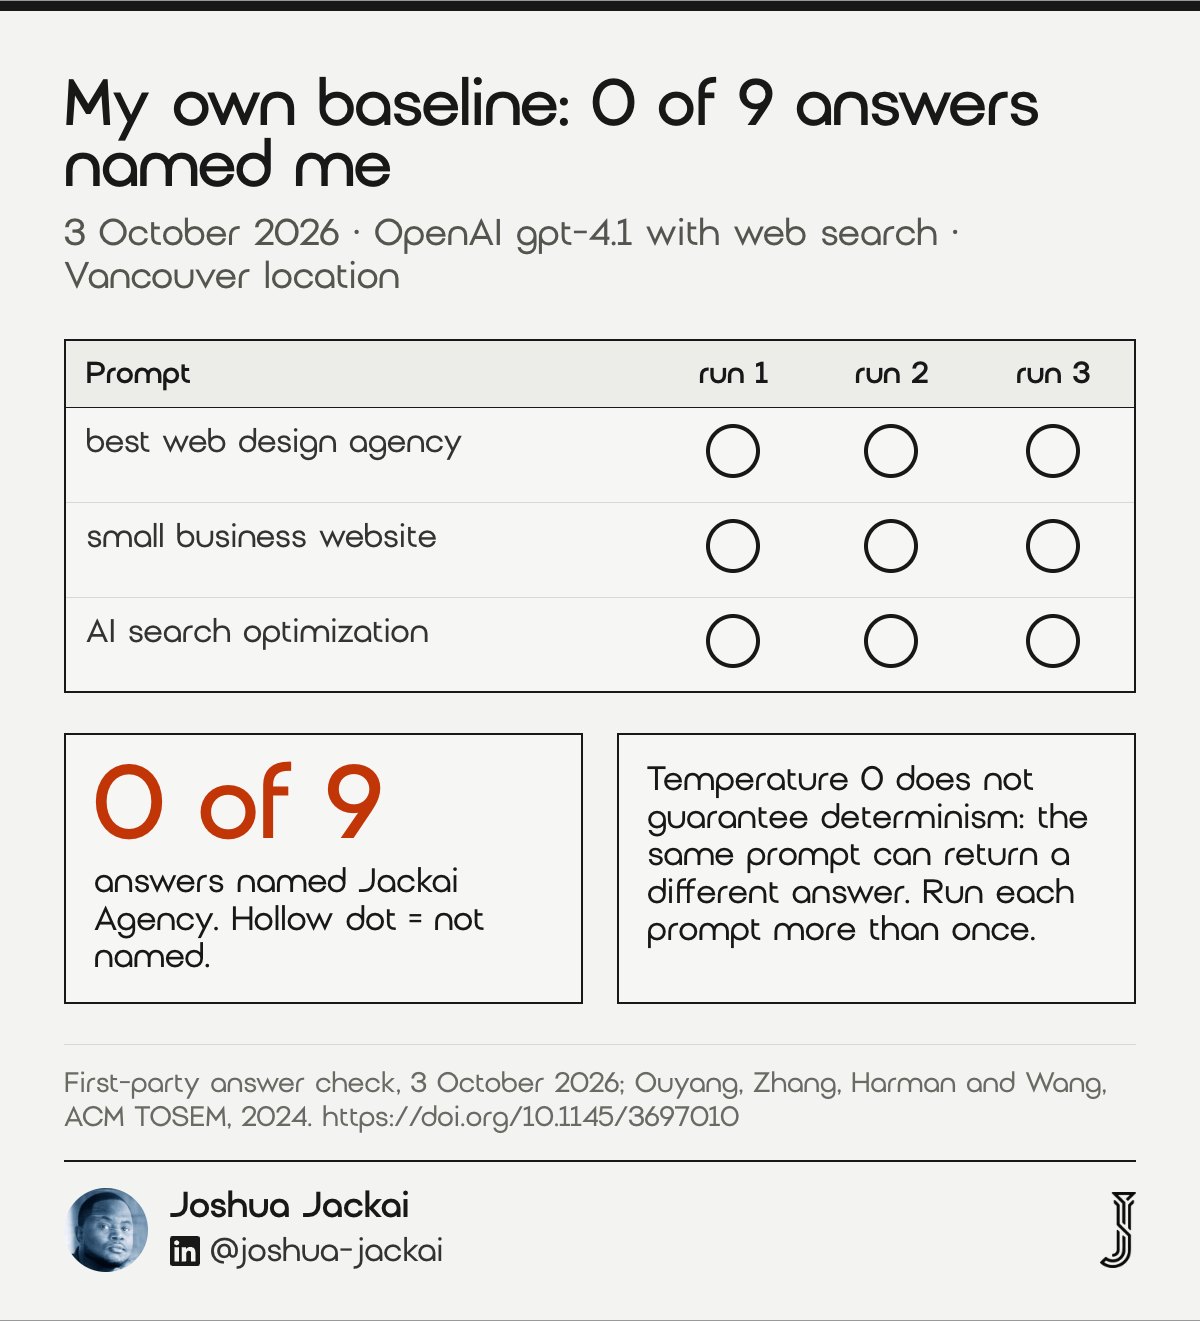
A baseline is the same prompt set run several times on each engine before you change anything, recorded as a rate rather than a yes or no. It suits anyone whose first check felt like a coin flip. ChatGPT returned zero equal test outputs across requests in 75.76% of one benchmark’s coding tasks (Ouyang and colleagues, 2024).
- Runs: at least 3 per prompt per engine, on different days if you can
- Record: the full answer text, every brand named, every cited URL, the date and the engine
- Output: a rate, for example 3 of 30 answers name you, or 10%
- Window: 2 weeks of baseline before the change goes live
- Watch for: a single screenshot used as proof
The study I lean on here is about code, not marketing, but the mechanism is the same: a language model samples its answer, so the same prompt can return a different answer on the next request. Ouyang, Zhang, Harman and Wang tested 829 coding problems and found the outputs unstable under default settings.
“setting the temperature to 0 does not guarantee determinism in code generation”
Shuyin Ouyang, Jie M. Zhang, Mark Harman and Meng Wang (ACM Transactions on Software Engineering and Methodology, 2024)
You don’t control the temperature in ChatGPT’s consumer app anyway, so assume the variation is there and measure through it. My own baseline for Jackai Agency, taken 3 October 2026, ran 3 prompts 3 times each through OpenAI’s gpt-4.1 with web search, set to a Vancouver location. Jackai Agency was named in 0 of 9 answers. That number is useful: it tells me the starting point is zero. It’s not big enough to measure a small lift, which is the subject of stage 6. A single screenshot is one draw from a distribution, and it proves nothing about the next draw.
“A single screenshot is one draw from a distribution, and it proves nothing about the next draw.”
Joshua Jackai, Vancouver web designer, said in this guide
4. What should you measure: mentions, citations or conversions?
Measure five things: mention rate, citation rate, citation accuracy, AI referral sessions and conversions from those sessions. The first three are leading signals you collect from answers; the last two come from your analytics. Accuracy matters because only 51.5% of generated sentences were fully supported by citations in one audit (Liu, Zhang and Liang, 2023).
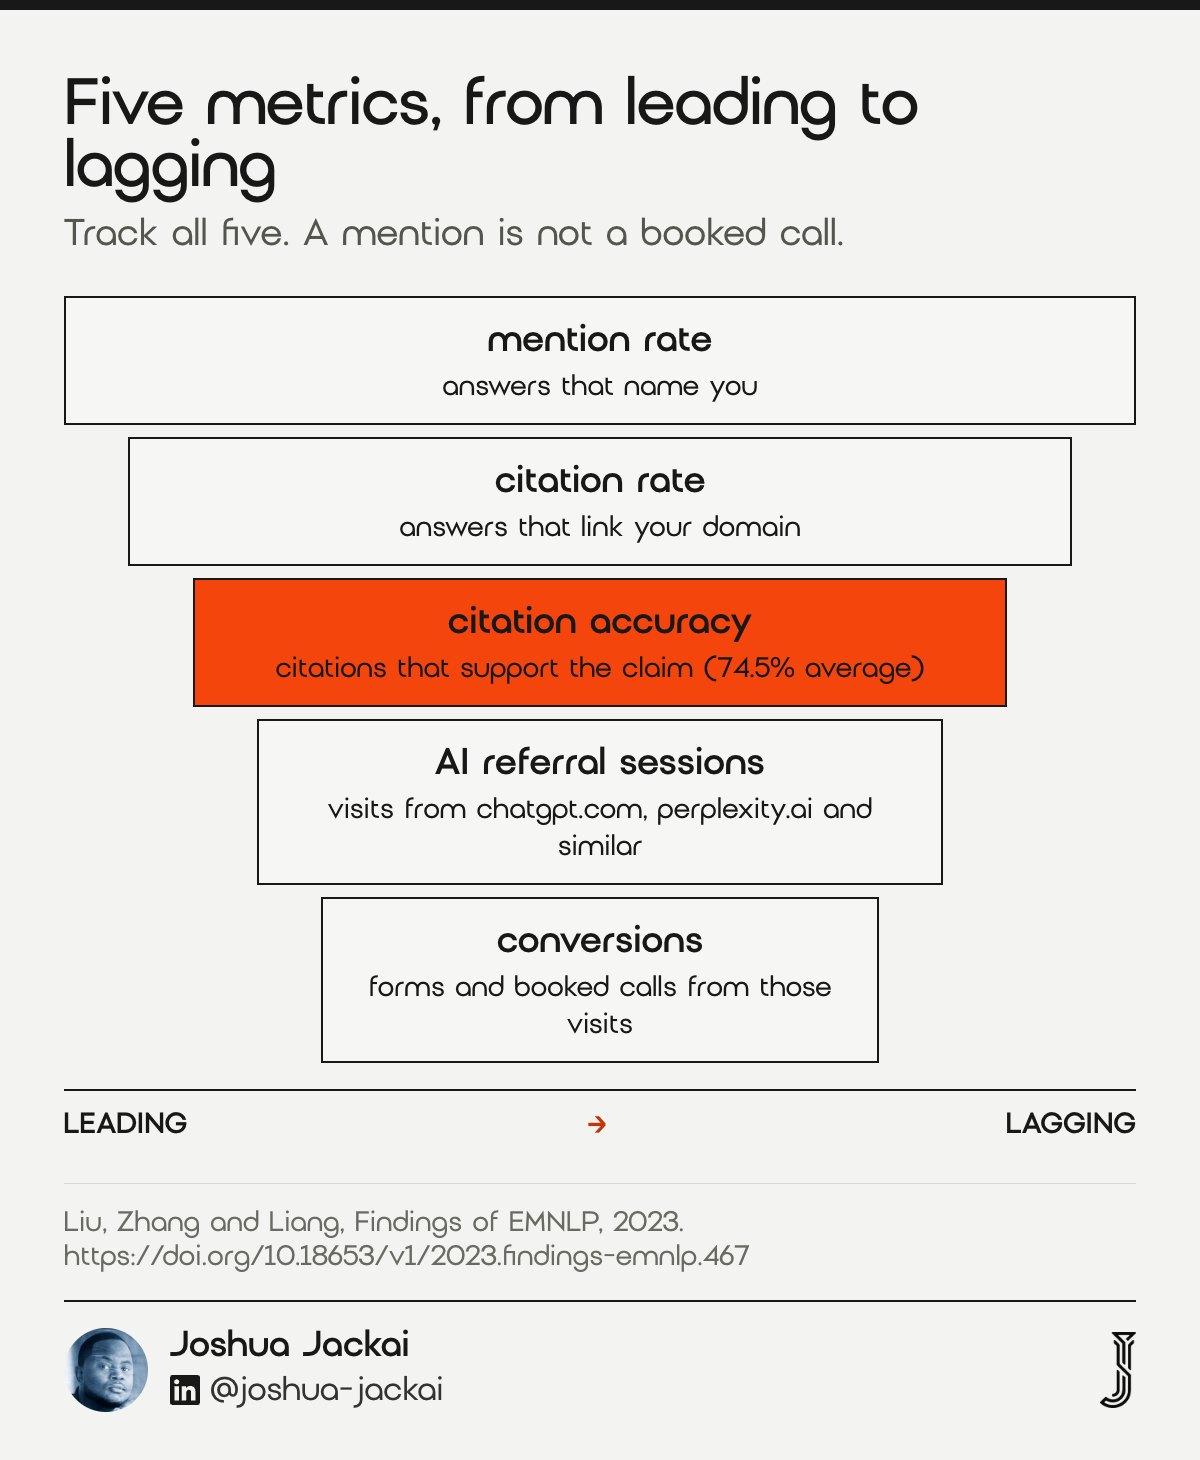
- Mention rate: answers that name your company, divided by answers checked
- Citation rate: answers that link a page on your domain, divided by answers checked
- Citation accuracy: citations whose linked page supports the sentence it sits beside
- AI referral sessions: analytics sessions from referrers such as chatgpt.com and perplexity.ai
- Conversions: enquiries and booked calls from those sessions
Mentions and citations are different events. ChatGPT can name your firm with no link, or link your blog post while recommending a competitor. Count both, separately. Then check accuracy: open each cited page and confirm it says what the answer claims. Liu, Zhang and Liang audited Bing Chat, NeevaAI, perplexity.ai and YouChat with human annotators.
“a mere 51.5% of generated sentences are fully supported by citations and only 74.5% of citations support their associated sentence”
Nelson F. Liu, Tianyi Zhang and Percy Liang (Findings of EMNLP, 2023)
A wrong citation that names your price incorrectly is worse than no citation, so log it as a defect.
“A wrong citation that names your price incorrectly is worse than no citation, so log it as a defect.”
Joshua Jackai, Vancouver web designer, said in this guide
The two lagging metrics live in your analytics. In my 3 October data file, ChatGPT’s links carried a utm_source=openai tag, which makes those visits easy to find in GA4. I group AI referrers into one custom channel so the conversion count sits next to organic search. Expect those numbers to be small for a B2B firm. That’s why leading metrics decide the test and conversions confirm it over a quarter. If you’re weighing who should run this work, my GEO agency vs AEO agency guide covers what each label usually includes.
5. How do you set up a control group for AI answers?
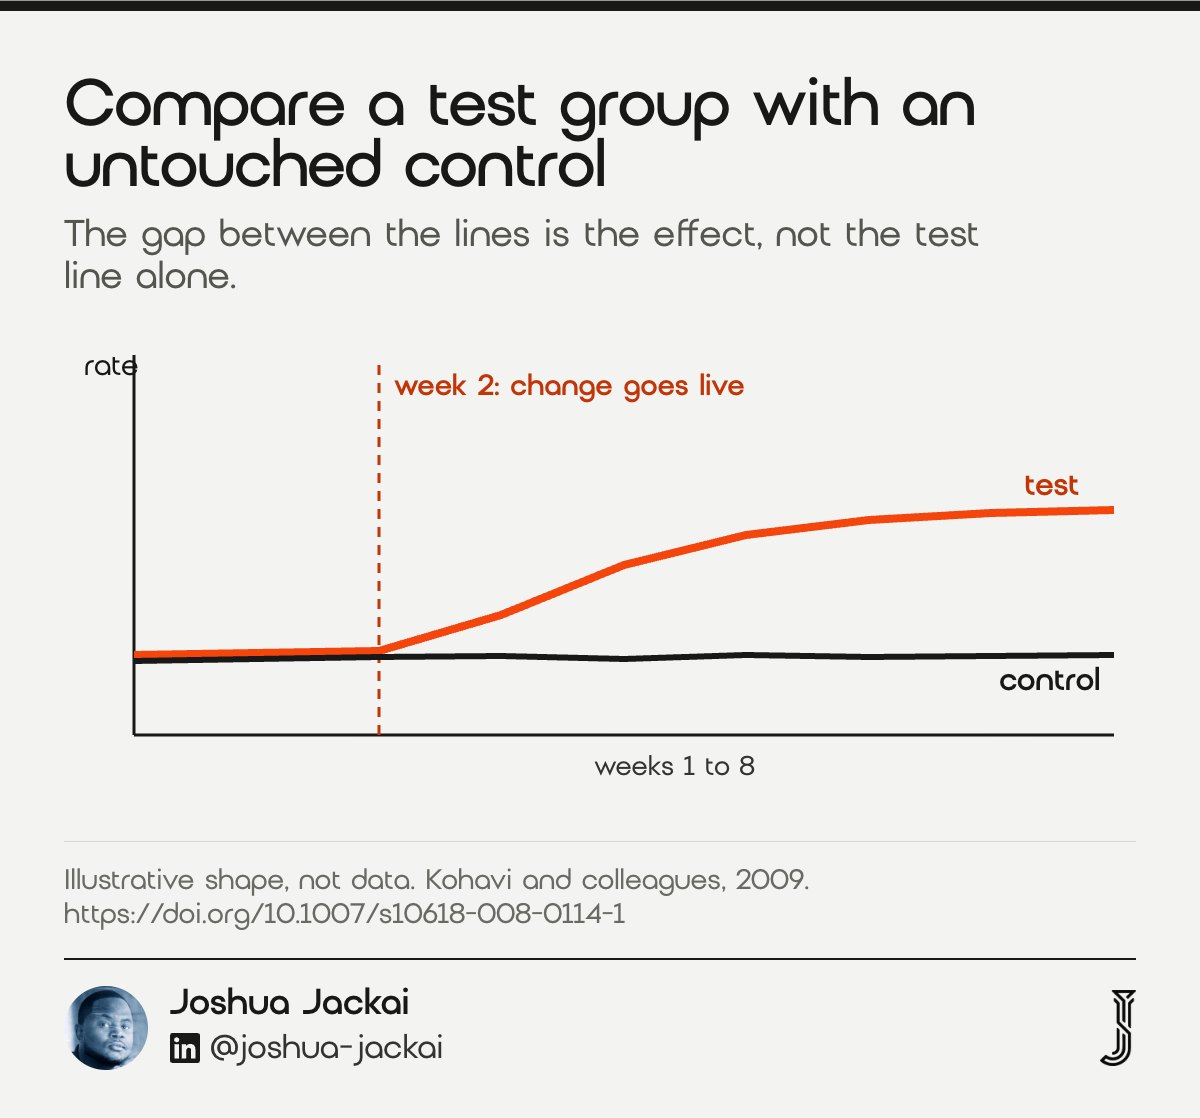
A control is a set of prompts, or pages, that you measure on the same days as the test group but don’t change. It separates your own work from engine updates and news. Kohavi and colleagues describe Control and Treatment tests as the basic design for causal claims (Data Mining and Knowledge Discovery, 2009).
- Control prompts: a similar group of prompts tied to pages you leave alone
- Same schedule: test and control checked on the same day, same engines, same location
- Read: the gap between groups, not the test group’s raw rise
- Size: roughly half the prompt set in each group
- Watch for: moving or redirecting pages during the test
AI answer engines change underneath you. A model update, a new crawl or a news story can lift or sink every prompt at once. If you only track the prompts you worked on, you’ll credit yourself for the engine’s changes and blame yourself for its bad weeks. The control group absorbs that noise. If both groups rise by the same amount, your change did nothing measurable. If the test group rises and the control stays flat, you have a result.
I learned this from my own sister site. On 1 October 2026, Google’s AI Overview for “How much does a Shopify website designer cost?” cited a Demand Designer cost guide among 12 sources, and the same overview showed up in 8 of 8 Vancouver searches that triggered one. On 15 October I moved that guide to a new URL with a 308 redirect. By 20 October, DataForSEO showed it was no longer cited on desktop or mobile. I can’t prove the move caused the drop, because I had no control group and the engine could have changed on its own. That’s the honest reading, and it’s why I now leave pages in place for the length of a test.
6. How many prompts and runs do you need to trust a change?
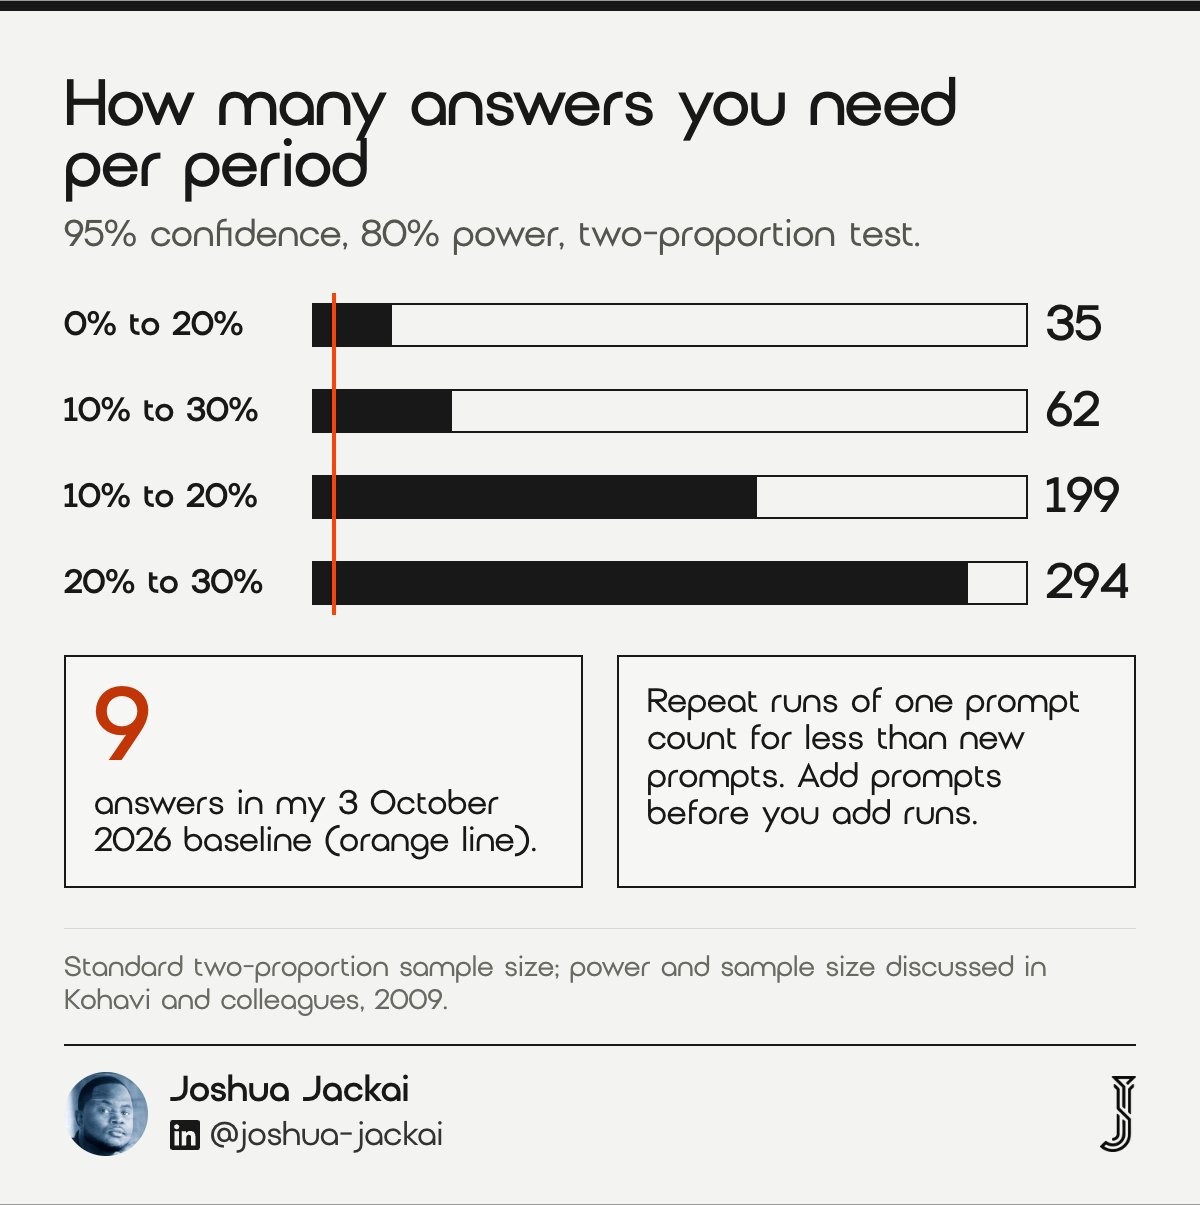
The number of answers you need depends on the starting rate and the lift you want to detect. Going from 10% to 30% needs about 62 answers per period at 95% confidence and 80% power; going from 10% to 20% needs about 199. Kohavi and colleagues list statistical power and sample size among the areas critical to experimentation (2009).
- Formula: the standard two-proportion sample size, 95% confidence, 80% power
- Big lift (10% to 30%): about 62 answers per period
- Small lift (10% to 20%): about 199 answers per period
- Repeat runs: count for less than new prompts, because answers to one prompt are correlated
- Watch for: calling a 1 in 10 to 2 in 10 change a doubling
Here’s the part most AEO guides skip. With 20 prompts and one run each, a jump from 2 mentions to 4 looks like a doubling, but it sits well inside normal noise. The maths is the same as an A/B test on a landing page: small samples can only detect big changes.
My 3 October baseline had 9 answers. That’s enough to say Jackai Agency was invisible on those prompts. It’s not enough to prove a move from 0% to 10%. To detect 0% to 20% I’d need about 35 answers per period, so my next check uses more prompts, not just more runs.
Why prompts over runs? Asking the same prompt five times gives five answers that lean the same way, because the engine is reading the same sources. Statisticians call that correlation within a cluster, and it shrinks your real sample. The prompt calculator in this guide lets you set how strongly runs of one prompt agree, then tells you how many distinct prompts to write. If the number it gives is more than you can check by hand, test a bigger change or accept a longer wait.
7. How long should you wait, and how often should you check?
Wait 4 to 8 weeks after the change, and check on the same weekday each week with the same engines and location. It gives a result without chasing daily swings. Using pre-test data let Bing reach the same power with half the users or half the duration (Deng, Xu, Kohavi and Walker, 2013).
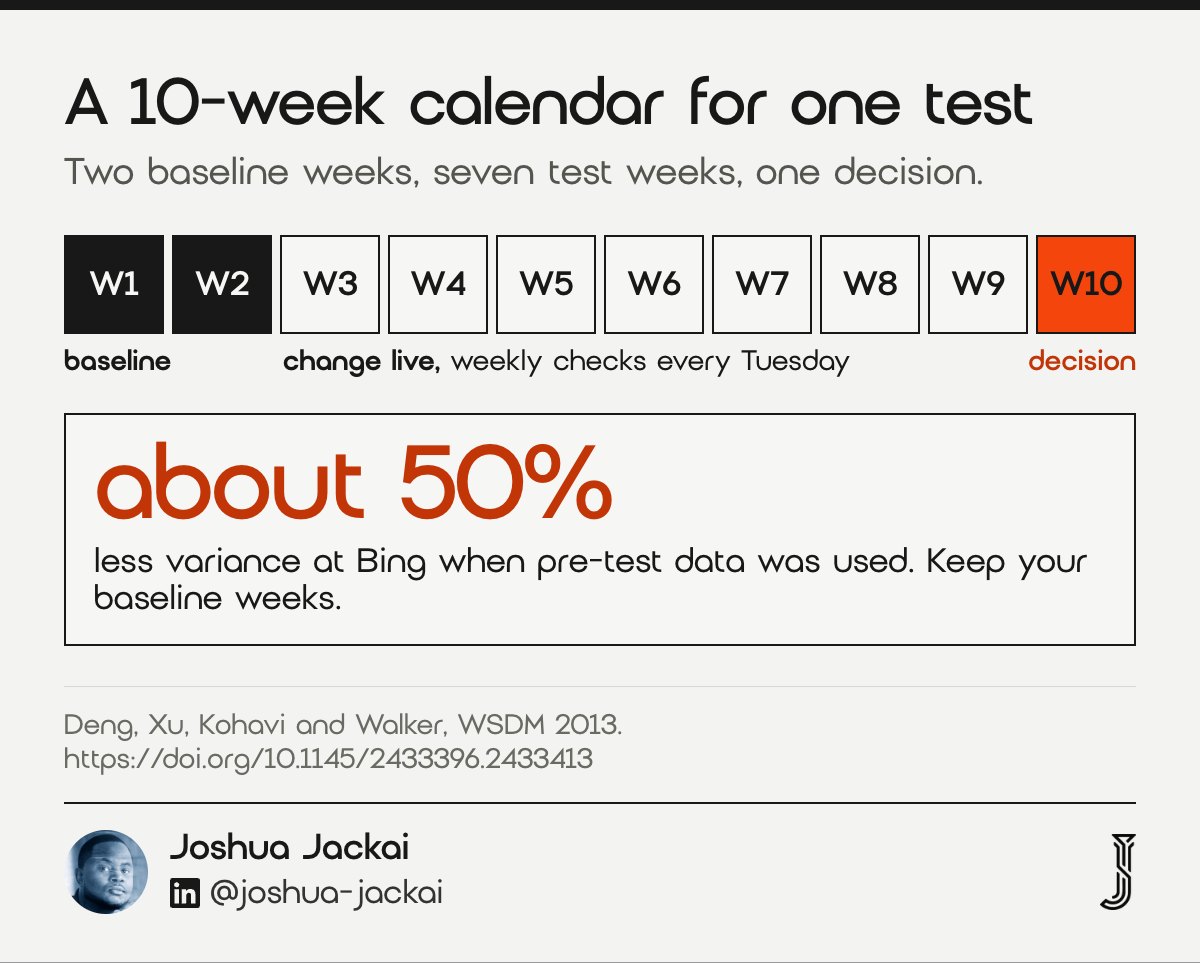
- Baseline: 2 weeks before the change
- Test window: 4 to 8 weeks after the change goes live
- Cadence: weekly, same day, same time zone
- Engines: the same three throughout; a new engine starts a new test
- Stop early only when: the change broke something or a cited fact is wrong
Engines don’t pick up a page change on a schedule you can see. Google has to crawl and re-index the page, and retrieval-based answers in ChatGPT and Perplexity depend on what their search layers return that week. A two-day check after a rewrite usually measures nothing but noise. I plan for at least four weekly checks after launch, and I write the decision date into the hypothesis so nobody stops the test the first week it looks good.
Deng and his co-authors showed why the baseline weeks pay off twice. Their method, CUPED, uses each unit’s pre-test behaviour to remove variance from the test reading.
“we can reduce variance by about 50%, effectively achieving the same statistical power with only half of the users, or half the duration.”
Alex Deng, Ya Xu, Ron Kohavi and Toby Walker (WSDM 2013)
You won’t run CUPED on a 40-prompt test by hand, but the idea carries over: compare each prompt with its own baseline rate, not with the average of all prompts. A prompt that named you 2 of 3 times before the change and 3 of 3 after tells you more than a pooled rate does.
8. How do you decide what to ship, extend or drop?
Close every test with one written decision: ship the change to similar pages, extend the test, or drop it. It ends the quarterly rerun of the same argument. Judge leading metrics against the control, then conversions over 90 days. Check accuracy too: only 74.5% of citations supported their sentence in one audit (Liu and colleagues, 2023).
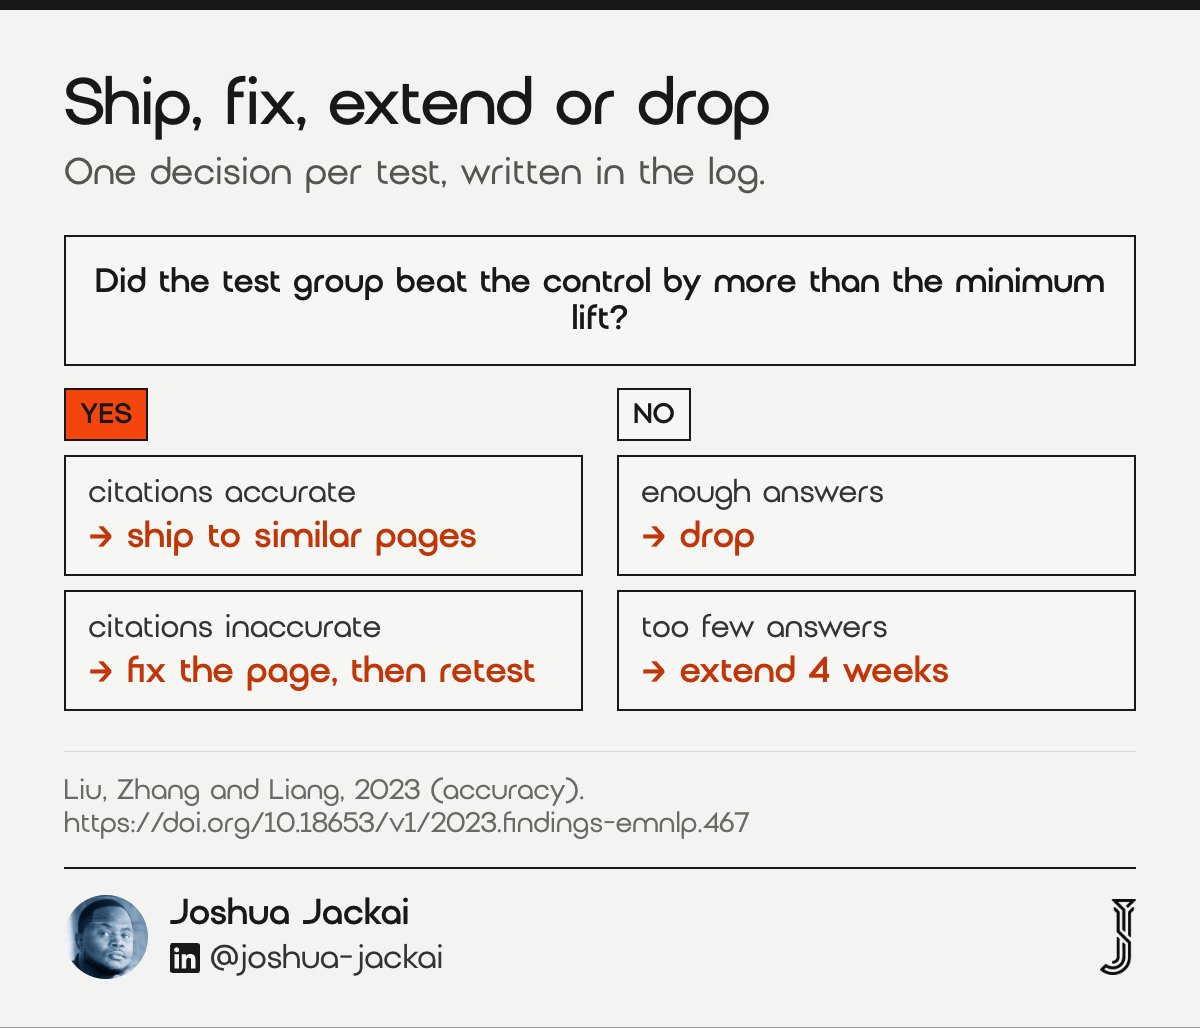
- Ship: test beat control by at least the lift you planned, and citations were accurate
- Fix and retest: you were cited, but the answer got your facts wrong
- Extend: the gap is promising but the answer count is short of the target
- Drop: enough answers, no gap between test and control
- Log: hypothesis, dates, counts, decision and the next test
A test log is the roadmap. Each closed test either becomes a rule, “pricing FAQs with CA$ figures lift cost-prompt mentions on our site”, or a crossed-out idea. After three or four tests you know which changes earn citations for your firm in your market, which is worth more than any generic checklist.
Be strict about the “drop” branch. If you collected enough answers and the gap isn’t there, the change didn’t work on those prompts, however good the page looks. Write that down and move on. I don’t call any change a win until it beats a baseline that was measured the same way.
“I don’t call any change a win until it beats a baseline that was measured the same way.”
Joshua Jackai, Vancouver web designer, said in this guide
Then connect it to money. A rise in mentions that never shows up as AI referral sessions or enquiries over a quarter may still be worth having for brand reasons, but it’s a different claim. Keep the two apart in the report. If you want to see where Canadian firms stand before you start, my study Does ChatGPT recommend Canadian businesses? shows what a baseline across Canadian prompts looks like.
How do you measure AI visibility without paid tools?
You can run an AEO test with a spreadsheet, a private browser window and your analytics. Paid trackers save time on large prompt sets, but the method doesn’t change. For a 40-prompt set across 3 engines, a weekly check with one run each is 120 answers to log.
- Spreadsheet columns: date, engine, prompt, run number, brands named, cited URLs, mentioned (yes or no), cited (yes or no), citation accurate (yes or no)
- Browser: a logged-out private window, so your history doesn’t shape the answer
- Location: note it on every row; Vancouver answers differ from Toronto answers
- Analytics: a GA4 channel group for AI referrers, with conversions attached
Logged-out checks matter. A signed-in ChatGPT account can remember that you asked about your own company yesterday, which inflates your mention rate. API checks with web search, like my 3 October run, avoid that and give you the full text to store.
Which mistakes ruin an AEO experiment?
Five mistakes ruin most AEO tests I review: no baseline, a prompt set that changes mid-test, one run per prompt, no control group, and moving the page during the test. Each makes the result unreadable, and the team still acts on it. The Demand Designer redirect in stage 5 is my own example of the last one.
- No baseline: you can’t tell a rise from the starting point
- Shifting prompts: the denominator changes and so does the rate
- One run per prompt: a single draw from an unstable answer
- No control: engine updates get credited to your work
- Moving pages: redirects and URL changes reset what the engine knows about the page
Compare AI visibility metrics side by side
Each metric answers a different question, and they arrive at different speeds. Use the filters to see which ones you can collect by hand, which need analytics, and which lead or lag. Citation accuracy is the one most teams skip, though only 74.5% of citations supported their sentence in one audit (Liu, Zhang and Liang, 2023).
| Metric | Question it answers | Speed | Collected | Evidence or source | Decides the test? |
|---|---|---|---|---|---|
| Mention rate | Do answers name my company? | Leading | By hand or tracker | Answers vary by run: temperature 0 does not guarantee determinism (Ouyang and colleagues, 2024) | Yes, against the control |
| Citation rate | Do answers link a page on my domain? | Leading | By hand or tracker | Visibility moved by up to 40% in GEO-bench (Aggarwal and colleagues, 2024) | Yes, against the control |
| Citation accuracy | Does the linked page support the sentence? | Leading | By hand | 74.5% of citations supported their sentence (Liu, Zhang and Liang, 2023) | Blocks shipping if wrong |
| Position in the answer | Am I first, or fifth of five? | Leading | By hand | Author’s practice; no peer-reviewed benchmark found | No, context only |
| AI referral sessions | Do people click through from AI answers? | Lagging | GA4 channel group | ChatGPT links carried utm_source=openai in the author’s October 2026 checks (first-party) | Confirms over a quarter |
| Conversions from AI referrals | Do those visits become enquiries? | Lagging | GA4 conversions | Small counts for most B2B firms; read over 90 days | Confirms over a quarter |
Showing 6 of 6 metrics.
“Decides the test” is the author’s judgement, not a measured figure.
How many prompts does your AEO test need?
Enter your baseline mention rate, the rate you hope to reach and how many runs you’ll do per prompt. The calculator uses the standard two-proportion sample size at 95% confidence and 80% power, then adjusts for repeat runs of one prompt. The default values are placeholders taken from the 10% to 30% example in stage 6.
All five values are placeholders. The 10% to 30% default matches the example in stage 6. 95% confidence (z = 1.96) and 80% power (z = 0.84) are the usual test settings. The 0.5 for how alike answers are is a guess, not a measured figure; raise it if one prompt gives the same answer on every run.
AEO experiment questions, answered
These answers come from the Vancouver People Also Ask results for AI visibility and answer engine searches, checked in November 2026. Each one points back to the stage that covers it in more depth. Where a number appears, it traces to the study named in stages 3 to 7.
How do you measure AI visibility?
Measure it as rates across a fixed prompt set: the share of answers that name you, the share that link your site, and the share of those links that are accurate. Run each prompt at least three times per engine, then track AI referral sessions and conversions in your analytics.
Can AI searches be tracked?
Partly. You can’t see what other people ask ChatGPT, but you can track your own fixed prompt set over time and count visits from chatgpt.com, perplexity.ai and similar referrers in GA4. ChatGPT links carried a utm_source=openai tag in my October 2026 checks, which helps attribution.
How long does AEO take to show results?
Plan for 4 to 8 weeks after a change before you judge it, with two weeks of baseline first. Engines need to crawl the page and their answers vary from run to run, so checks in the first few days mostly measure noise rather than your change.
How many prompts should an AI visibility test use?
Enough to detect the change you care about. At 95% confidence and 80% power, moving from 10% to 30% needs about 62 answers per period, while 10% to 20% needs about 199. Add prompts before you add repeat runs, because runs of one prompt agree with each other.
How I run AEO tests for Canadian B2B firms
I set up the prompt set, the baseline, the control group and the GA4 channel, then run the weekly checks and write the decision log. It suits Vancouver and Canadian B2B firms that want proof before they spend more. My GEO and AI visibility package is CA$4,775 (Jackai Agency pricing, November 2026).
I don’t have client AEO results to show yet, and I won’t borrow anyone else’s. What I can show is the method on my own firm: the 3 October baseline, 0 of 9, and the Demand Designer citation I lost after a redirect, logged with the limits of what it proves.
If you want a starting number before you commit, the free AI Visibility Report checks how ChatGPT, Perplexity and Google answer prompts about your company and comes back within 24 hours. The AI visibility optimization service page covers what the paid work includes, and the CA$995 website audit is credited if a project starts within 30 days.
Book a 30-minute call and bring the prompts your buyers ask.
Sources
Peer-reviewed research
- Aggarwal, P., Murahari, V., Rajpurohit, T., Kalyan, A., Narasimhan, K., and Deshpande, A. (2024). GEO: Generative Engine Optimization. Proceedings of the 30th ACM SIGKDD Conference on Knowledge Discovery and Data Mining.
- Deng, A., Xu, Y., Kohavi, R., and Walker, T. (2013). Improving the sensitivity of online controlled experiments by utilizing pre-experiment data. Proceedings of the Sixth ACM International Conference on Web Search and Data Mining.
- Kohavi, R., Longbotham, R., Sommerfield, D., and Henne, R. M. (2009). Controlled experiments on the web: survey and practical guide. Data Mining and Knowledge Discovery, 18(1), 140-181.
- Liu, N. F., Zhang, T., and Liang, P. (2023). Evaluating verifiability in generative search engines. Findings of the Association for Computational Linguistics: EMNLP 2023.
- Ouyang, S., Zhang, J. M., Harman, M., and Wang, M. (2024). An empirical study of the non-determinism of ChatGPT in code generation. ACM Transactions on Software Engineering and Methodology.
Industry and first-party sources (not peer reviewed)
- Jackai Agency AI answer check, 3 October 2026: OpenAI gpt-4.1 with web search via the API, Vancouver location, 3 prompts by 3 runs (first-party data).
- Demand Designer AI Overview citation record, 1 to 20 October 2026: AlsoAsked bulk export for Vancouver and DataForSEO checks (first-party data).
- Vancouver People Also Ask data for AI visibility and answer engine searches, AlsoAsked export, accessed November 2026.
- Jackai Agency price table, November 2026 (first-party prices, CAD before tax). Jackai Agency pricing