
- Result
- 7 figures of ARR influenced, Figma to production in 3 weeks
- Client
- Snappy Kraken, a B2B FinTech SaaS for financial advisors
- Scope
- Website redesign, pricing page, design system
- Stack
- Figma, HubSpot CMS, HubL
Figma to HubSpot CMS in 3 weeks for a FinTech SaaS platform
HubSpot CMS website redesign for a B2B FinTech SaaS company. Client: Snappy Kraken, A B2B FinTech SaaS selling marketing systems to financial advisors.
An advisor has 40 minutes between client meetings and a marketing budget she has to defend in front of a partner. She has already watched the demo. She is not asking what the software does. She is asking what it costs, what happens in month 2, and whether she will be the one holding it when it breaks. The pricing page loads. It has 3 columns, 9 rows of feature names, and no sentence written for a person who has to justify the number to somebody else. She opens a second tab and starts comparing. The product was never the problem. The page where the decision actually happens was doing none of the work.
Software does not lose the deal on the demo. It loses it on the page that explains the price.
What was actually happening?
The site explained the product to people who were already sold and asked nothing of the advisor still deciding. The pricing page carried the most traffic and the least design. Marketing owned a roadmap larger than the team could build, so anything shipped had to be editable by the in-house team afterwards, without a designer in the loop.
Every figure below is a real capture of the live page. Each frame caps its height and scrolls inside itself, so a full-page capture can be read end to end without leaving the figure. Both frames are reachable by keyboard. Nothing here is a mockup or a drawn schematic.
1. What changes when a SaaS homepage is written for the advisor who has not decided?


UX and UI analysis, before against after
Before: what the design cost the visitor
- Features led, the buyer was not named. The page opened with product capability and never said who it was for. When a visitor cannot see themselves in the first fold, the information scent is weak and the research shows they leave rather than dig. Source: Nielsen Norman Group, 2003.
- One action, four phrasings. The primary action was repeated four times in four different wordings. Each variant reads as a different choice, and adding choices reduces the rate at which people commit to any of them. Source: Columbia University and Stanford University, Iyengar and Lepper, Journal of Personality and Social Psychology, 2000.
- Capability copy is hard to scan. Seventy-nine percent of users scan rather than read. Feature language written for people who already understand the product gives a scanning advisor nothing to catch on. Source: Nielsen Norman Group, 1997.
After: what changed and why it works
- The advisor is named in the first fold. The page says who it serves before it says what it does. A headline that names the reader is the strongest form of information scent a page can give. Source: Nielsen Norman Group, 2015.
- One action, identical wording throughout. The same call to action in the same words on every screen turns four apparent choices into one clear next step, which is the condition under which people act. Source: Nielsen Norman Group, 2013.
- Written to be scanned. Short headings and one idea per block let a reader who takes in only a fifth of the words still leave with the point. That is how much of a page the research says people actually read. Source: Nielsen Norman Group, 2008.
Sources cited in this section
- Nielsen Norman Group (2003), Information Scent: how users decide where to click.
- Columbia University and Stanford University, Iyengar and Lepper, Journal of Personality and Social Psychology (2000), When Choice is Demotivating: more options reduced purchase rate roughly tenfold.
- Nielsen Norman Group (1997), How Users Read on the Web (79% of users scan rather than read).
- Nielsen Norman Group (2015), Headings Are Pick-Up Lines: 5 Tips for Writing Headlines That Convert.
- Nielsen Norman Group (2013), Minimize Cognitive Load to Maximize Usability.
- Nielsen Norman Group (2008), How Little Do Users Read? (about 20% of the words on an average page).
2. How should a SaaS pricing page be structured for a considered purchase?
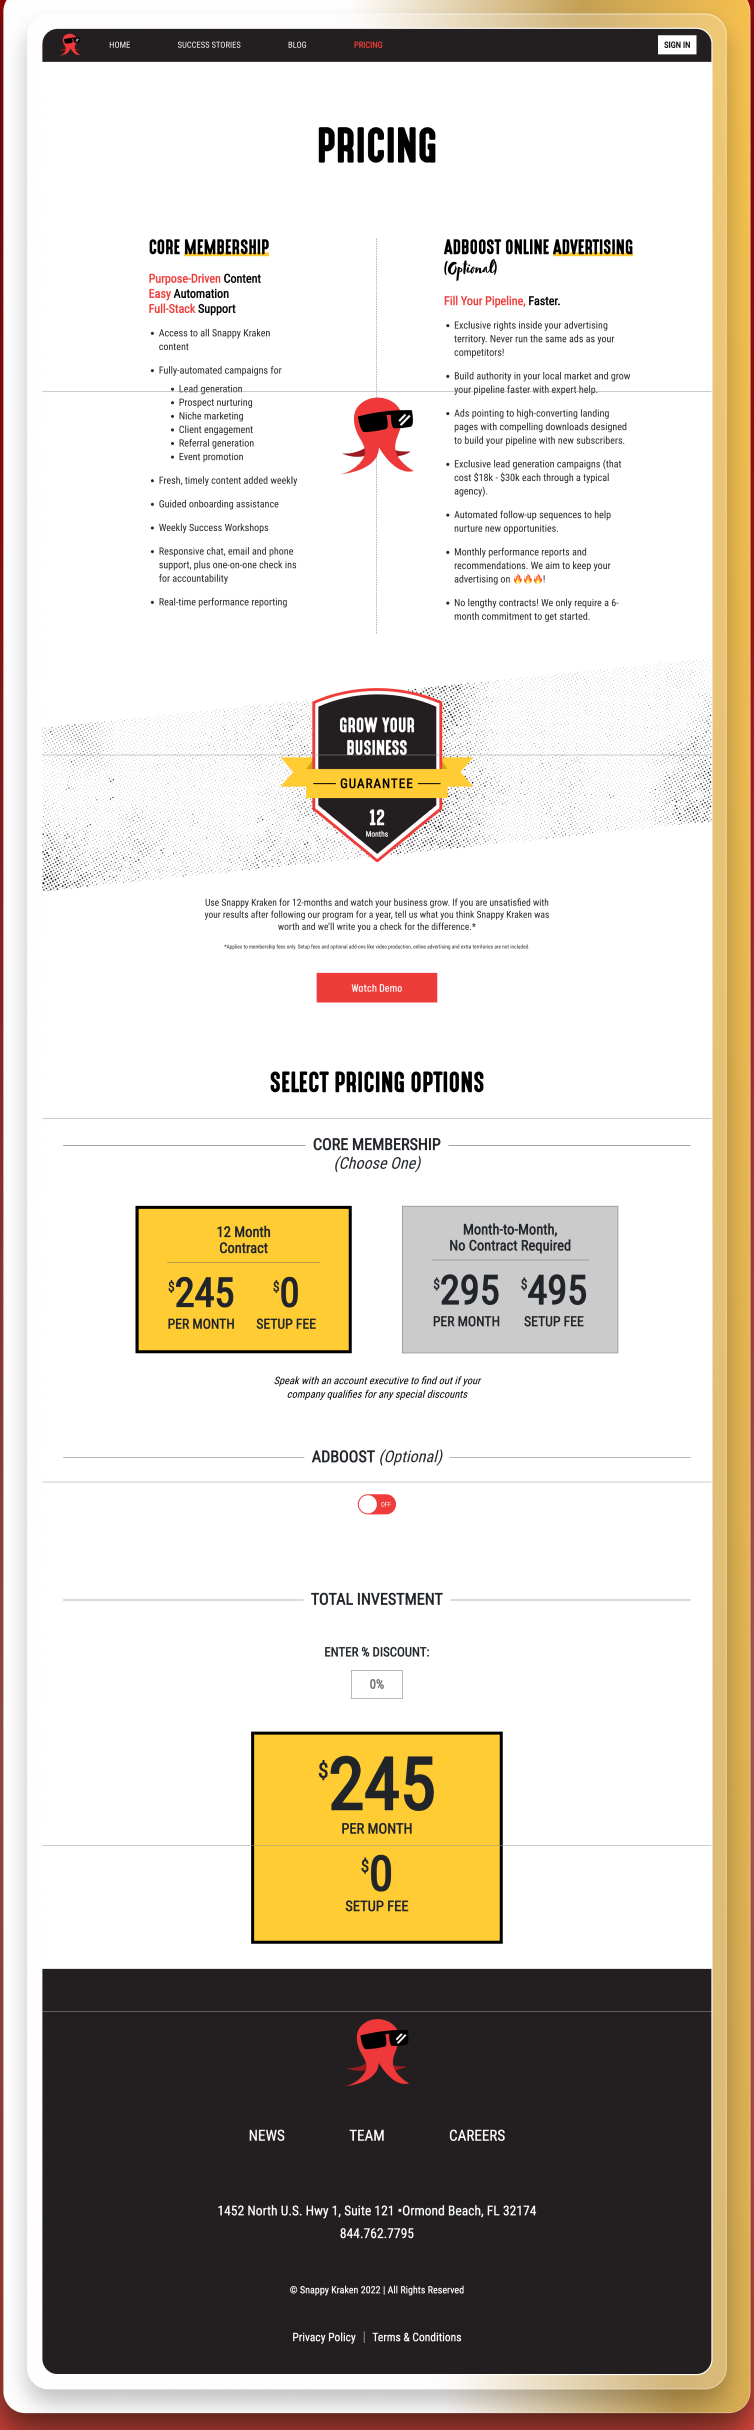
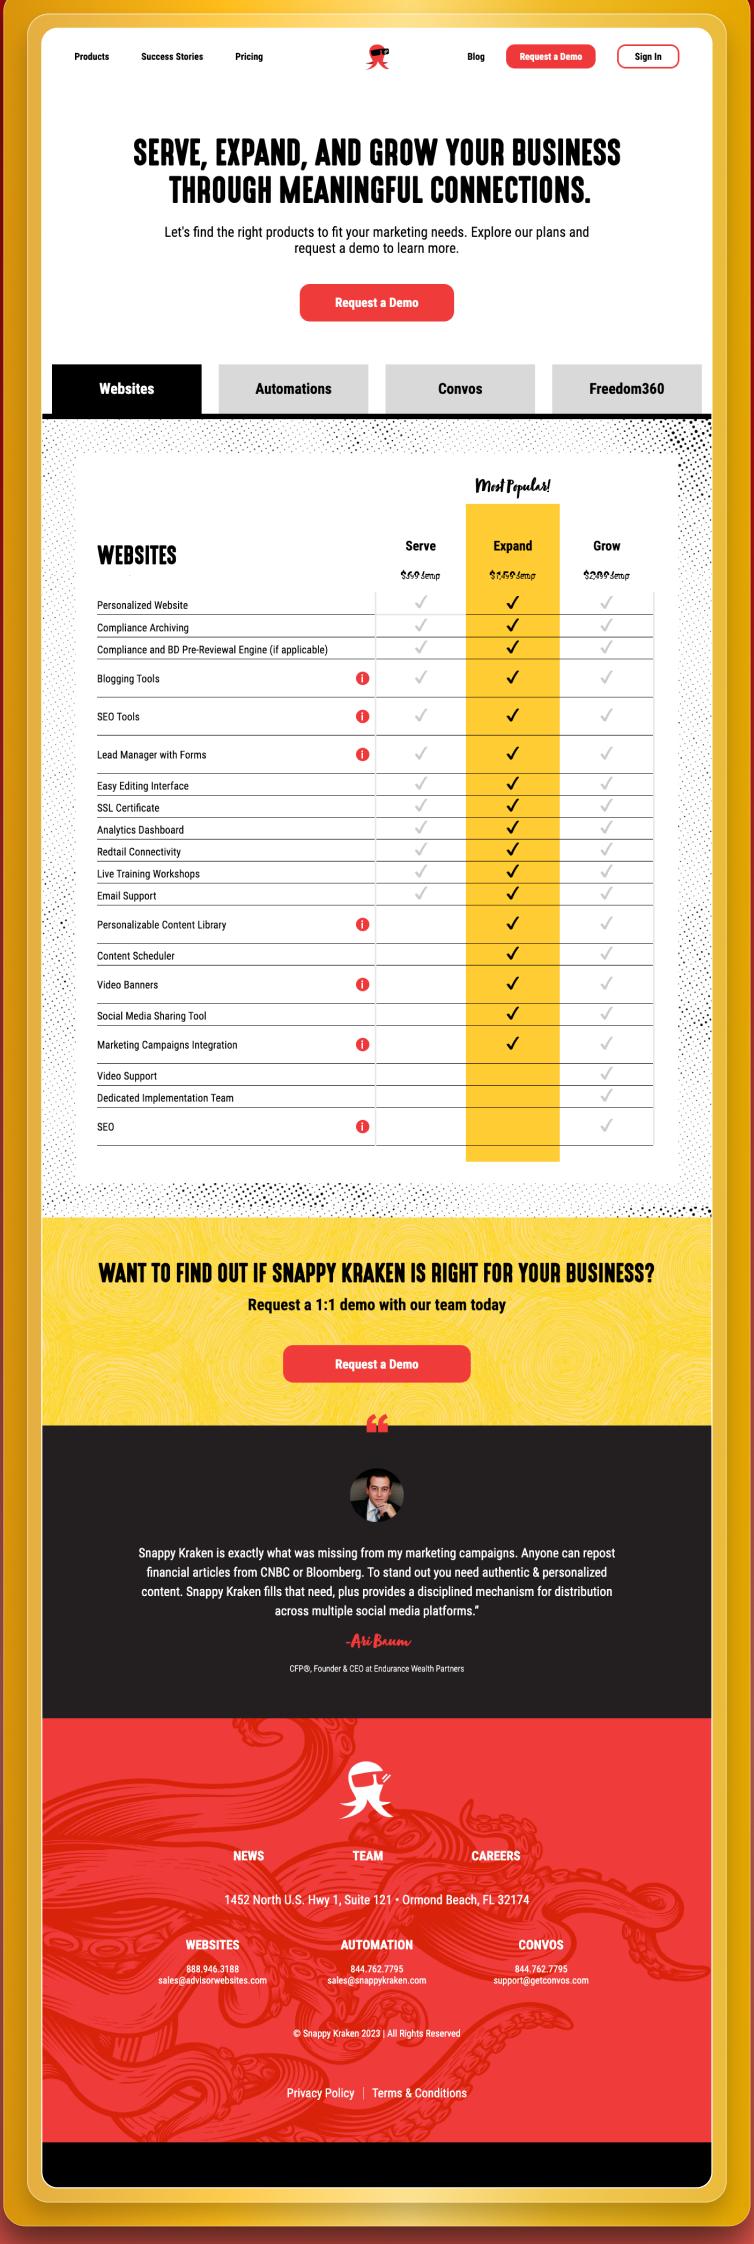
UX and UI analysis, before against after
Before: what the design cost the visitor
- A three-column plan table with no explanation. Feature rows with ticks do not tell a considered buyer what changes between tiers. Nielsen Norman Group’s comparison table research finds that tables of raw attributes fail when the reader cannot see which difference matters to them. Source: Nielsen Norman Group, 2017.
- The objection was left unanswered. A pricing page that states the number without addressing the reason for hesitation pushes the buyer to a sales call or off the page. The credibility research is clear that unanswered questions read as something being hidden. Source: Nielsen Norman Group, 2016.
- Too much on one screen. Every tier, every row and every action competing at once is the pattern the cognitive load research warns against for decisions that carry a price. Source: Nielsen Norman Group, 2013.
After: what changed and why it works
- One focal action per screen. Each tier gets its own space and one next step, so the page moves the buyer forward one decision at a time. Source: Nielsen Norman Group, 2013.
- Differences stated in sentences. What changes between plans is written in plain language beside each tier, which is the format the comparison table research recommends for considered purchases. Source: Nielsen Norman Group, 2017.
- The objection sits beside the number. The reason a buyer might hesitate is answered next to the price. Plain, direct disclosure is one of the four credibility factors that make a page trustworthy. Source: Nielsen Norman Group, 2017.
Sources cited in this section
- Nielsen Norman Group (2017), Comparison Tables for Products, Services, and Features.
- Nielsen Norman Group (2016), Trustworthiness in Web Design: 4 Credibility Factors.
- Nielsen Norman Group (2013), Minimize Cognitive Load to Maximize Usability.
- Nielsen Norman Group (2017), Plain Language Is for Everyone, Even Experts.
Before against after, with the measured column
| What | Before | After | Measured |
|---|---|---|---|
| Build path | Design handed over as static files | Figma to HubSpot CMS with HubL templates | Yes, 3 weeks to production |
| Page ownership | Developer required for edits | Marketing team edits inside the design system | Not measured |
| Pricing page | Feature table | 1 focal action per screen | Not measured |
| Commercial outcome | Not attributed | 7 figures of ARR influenced | Influenced, not attributed |
What was built?
- 6 responsive pages taken from Figma to live in HubSpot CMS with HubL templates.
- A bound design system so the in-house marketing team can ship pages without a designer.
- The pricing page rebuilt with 1 focal action per screen and plan differences written as sentences.
- Conversion paths mapped to the advisor decision rather than the feature list.
What did the redesign produce?
The pages went from Figma to production in 3 weeks on HubSpot CMS, and the work influenced 7 figures of ARR.
The honest limitation
ARR is influenced, not attributed. Sales, pricing and product all moved inside the same period, and this page does not separate them.
This engagement runs as Website Design.
Pick a time. We set the baseline on the call.
Mobile conversion rate, AI-referred traffic and lead count, measured before any work starts. You leave with the window and the number, whether or not you hire me.
If the calendar does not load here, the host is blocking the frame. Open it in a new tab with the link above.
